
Turn a carbon footprint into a plan that holds up.
Most decarbonisation plans are built in a spreadsheet next to the footprint, not out of it. The Action Plan module builds them from the footprint itself — every tonne claimed is traceable to the activity line and the emission factor it came from.
Built on real rows
Measures act on the actual footprint lines — filtered by scope, entity, site, vector, country — not on category totals.
Four transformations
Every measure resolves to one of four auditable operations on quantities or emission factors.
Always reconciled
Any edit replays the whole plan from the baseline. Totals can never drift from the measures shown.
Benchmarked live
Gap to an SBTi or internal target, plus business-as-usual, recomputed on every change.
The problem
A transition plan is only as good as its arithmetic
Boards approve reduction targets. Auditors, banks and regulators increasingly ask how they will be met — measure by measure, with the numbers behind each one. That question is where most action plans come apart.
The footprint is calculated in one system and the plan is built in another. Six months later the footprint is restated, an entity is acquired, an emission factor is updated — and nobody can say which lines of the plan moved. The reduction percentages in the board deck no longer reconcile with anything.
Plan in a spreadsheet
- Reductions expressed as percentages off a category total nobody can re-derive
- Restating the footprint silently invalidates the plan
- Measure order and interactions handled by hand, or not at all
- Scope 3 upstream effects of a Scope 1 measure routinely missed
- One file per option, diverging from the day it is copied
Plan in myClimact
- Each measure is a selection of real footprint lines plus one transformation
- Re-baseline onto a new year or a restated footprint, and re-state the plan against it
- Order is part of the plan; the whole sequence is replayed on every change
- Linked upstream lines are detected and offered, not left to memory
- Options live side by side and are compared against BAU and target
Three things that set it apart
01 · Traceability
Nothing is retyped
The plan starts from the exact rows the calculation produced. There is no reconciliation step between the footprint and the plan, because there is no second copy of the data.
02 · Reproducibility
The plan recomputes itself
Add, edit, reorder or remove a measure and the sequence is replayed from the baseline, server-side. What you present is always what the measures produce.
03 · Honesty
No placeholder numbers
A scenario the data cannot support is withheld rather than approximated. In a document that will be audited, a plausible placeholder is worse than an absent one.
01
Where the module fits
myClimact carries an organisation through the full decarbonisation cycle, from understanding its climate exposure to disclosing its progress. The Action Plan is step 4 — the point where a footprint stops being a diagnosis and becomes a plan. It consumes what steps 2 and 3 produced, and feeds the implementation and disclosure work of steps 5 and 6.
- 01Understand
- 02Measure
- 03Set Targets
- 04Take Action
- 05Foster Accountability
- 06Disclose & Communicate
The five objects to know
| Object | What it is |
|---|---|
| Dataset | A calculated carbon footprint, typically multi-year, covering both market-based and location-based accounting. Produced in step 2 — the Action Plan reads it, never re-computes it. |
| Baseline | The single reporting year and GHG report a plan works on, extracted as a row-level table of activity data, emission factors and emissions. |
| Plan option | A named, ordered scenario built on one baseline. An organisation holds as many in parallel as it needs — ambitious, conservative, per site — and compares them. |
| Measure | A selection of footprint lines plus one transformation applied to them. Ordered, editable, removable, replayed deterministically. |
| Target set | The commitment the plan is benchmarked against, with a target year and a per-scope split. Built in the SBTi flow of step 3, or inline. |
02
What you can do with it
Build a measure against the real footprint
A measure is defined against actual lines, not an abstract category. The baseline is presented as a filterable table, and every dimension the footprint carries becomes a filter — scope, GHG Protocol category, legal entity, activity, source or energy vector, country, unit, emission-factor request, reporting period, plus any column specific to your own data model.
- Filters combine, and the count of matching lines updates continuously.
- Individual lines can then be included or excluded one by one, so a measure can be scoped to a single site or a single contract.
- The preview shows the quantity, emission factor and emissions of every candidate line, sortable on any dimension.
Upstream consistency, handled
When a selection of Scope 1 or 2 lines has matching upstream Scope 3 lines — same entity, source vector, unit, country, period and quantity — the platform detects them and offers to include them in the same measure. Cutting on-site gas consumption without also cutting its well-to-tank emissions is a classic source of overstated Scope 3. The module makes that choice explicit rather than silent.
Four transformations, deliberately few
Whatever its label, every measure resolves to one of four operations. Each maps to a way abatement is actually engineered or contracted — and each is auditable.
| Transformation | What it does | Typical use |
|---|---|---|
| Scale quantity | Multiplies the activity quantity of every selected line by a factor; emissions follow. | Efficiency programmes, demand reduction, modal shift — 15 % less process heat by 2030. |
| Set quantity | Sets an explicit new quantity, line by line. | A known future state: a decommissioned boiler, a fleet fixed by contract. |
| Set emission factor | Overrides the emission factor of selected lines, leaving activity untouched. | Fuel and electricity switching: green PPA, biomethane, low-carbon material, a supplier with a lower verified factor. |
| Reduce by a fixed tonnage | Removes an absolute tCO2e volume, spread across the selected lines pro-rata to their share of emissions. | A contracted abatement volume, or a measure quantified externally in tonnes. |
A measure can also carry its own target year, which is what lets a plan read as a trajectory rather than a single-year swap.
Keep the plan and its totals in lockstep
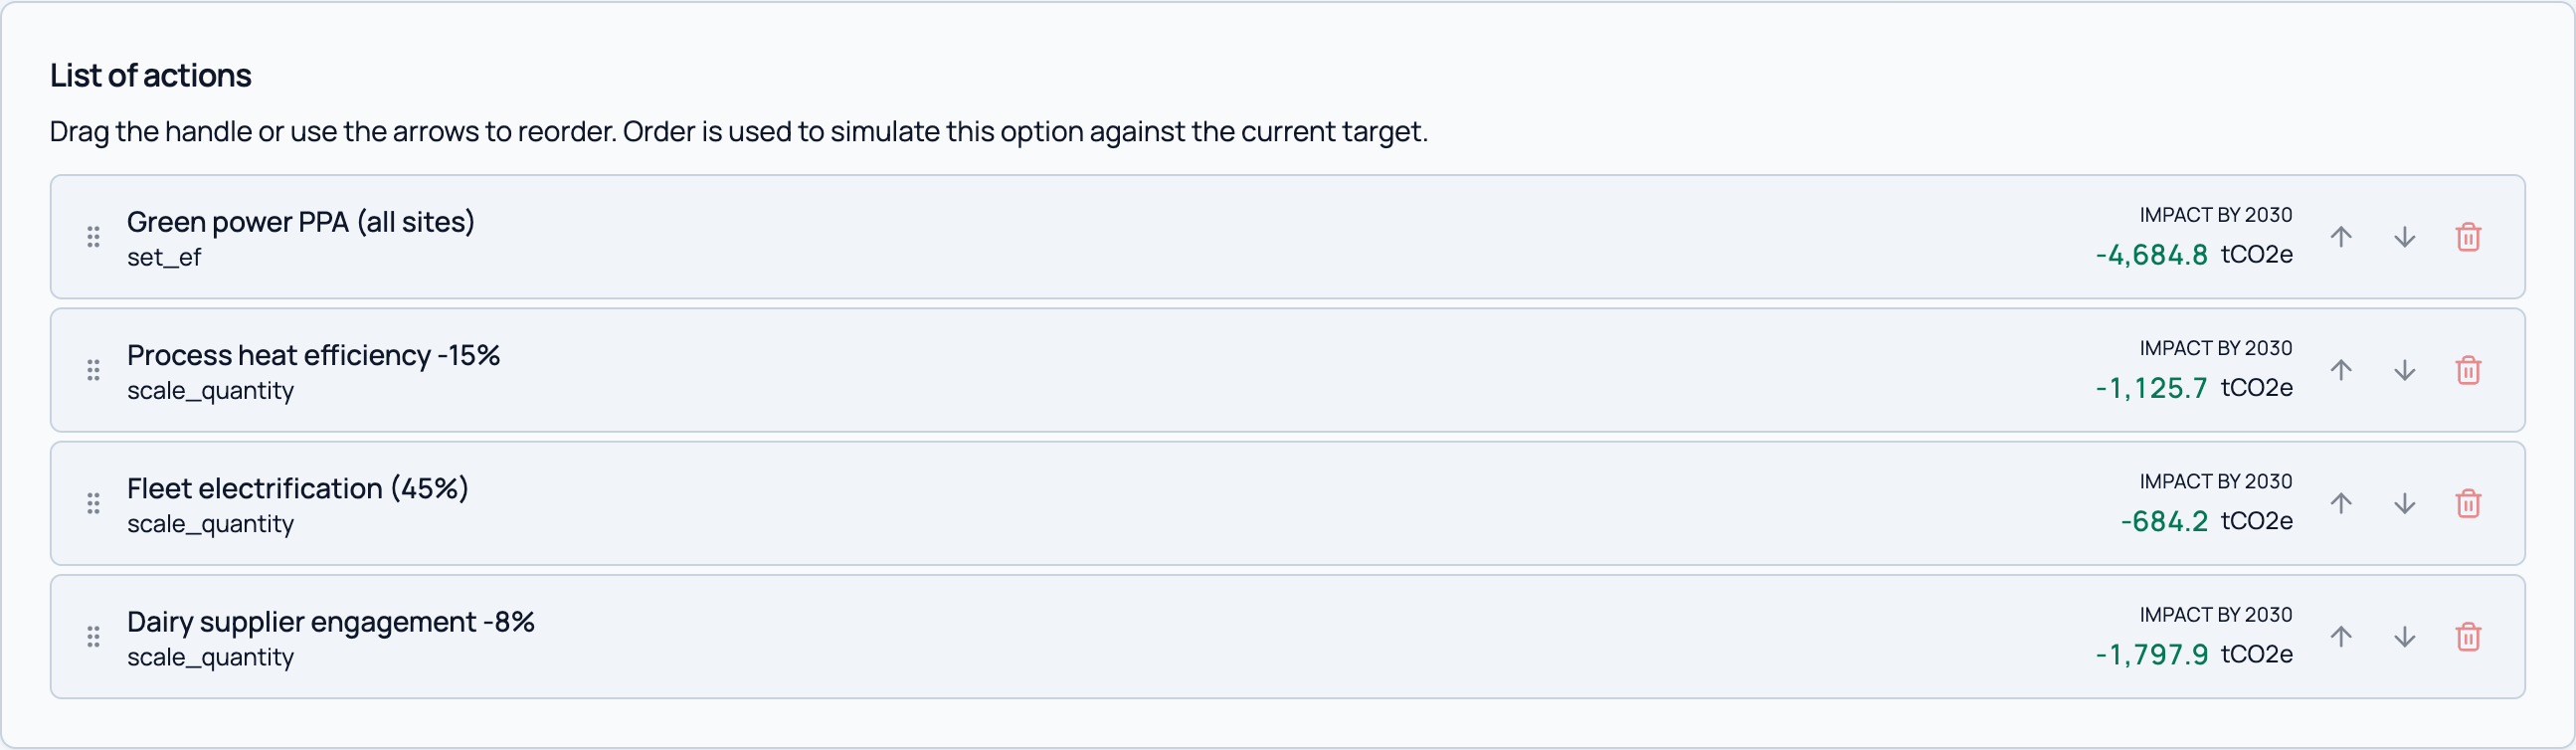
Measures are held as an ordered list, because order changes results: a 20 % efficiency gain applied after an electricity switch does not yield the same tonnage as before it. Order is therefore part of the plan, not a display preference.
- Reorder by drag and drop; the plan is recomputed from the baseline on every change.
- Editing a measure's filters or parameters, or deleting it, triggers the same full replay.
- A measure that can no longer apply — an absolute reduction larger than what remains in its selection — is flagged for correction, never silently dropped.
- The complete action history is stored with the plan and travels into the export.
See what each measure delivers
- Headline indicators — baseline, result at the target year, absolute and relative change, number of measures.
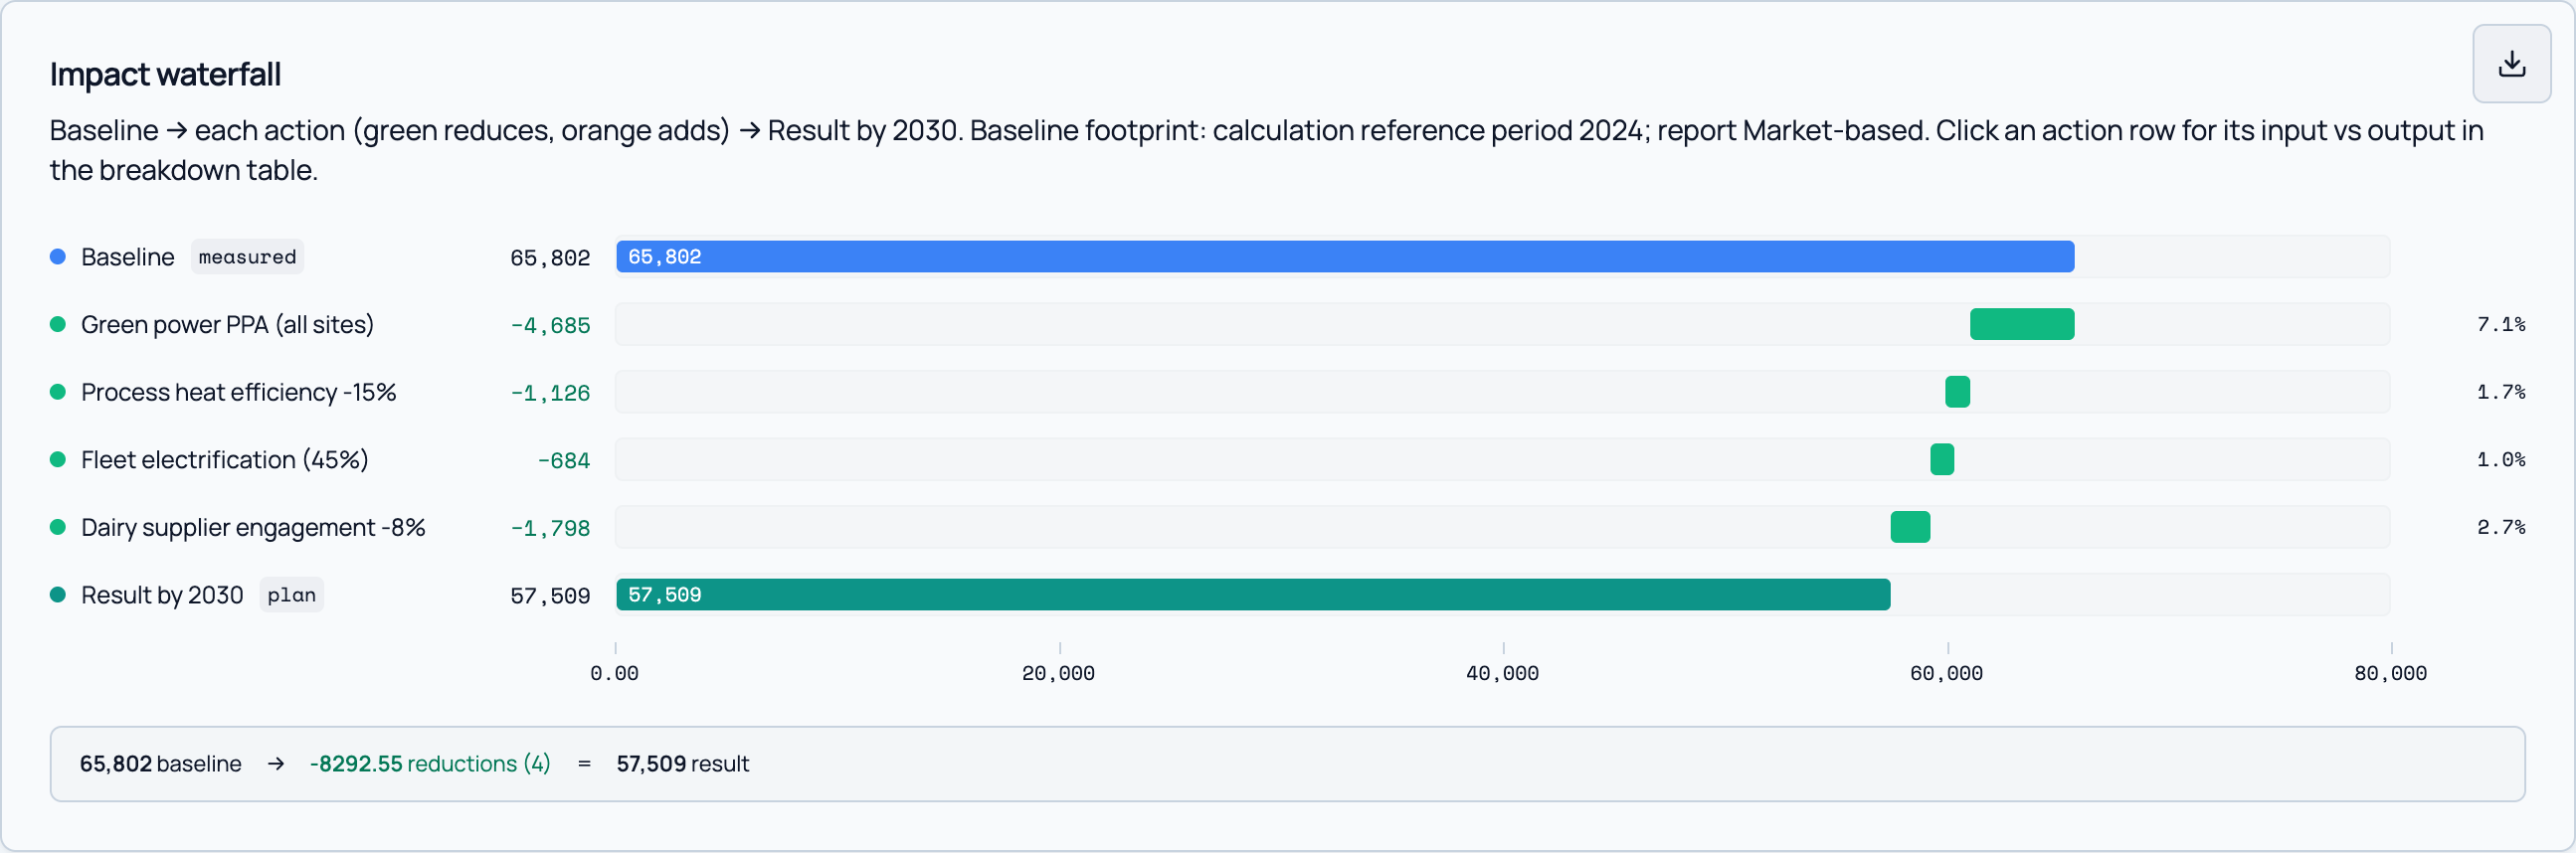
- Impact waterfall — one bar per measure in plan order, each carrying the Scope 1/2/3 totals before and after it. The replay, made visible.
- Breakdown table — before, after, delta and delta % grouped on up to three dimensions of your choosing (entity, then activity, then vector, for instance), so the plan reads from any organisational angle.
- Emissions over time — historical reporting years, the plan result at the target year, the target trajectory, and the business-as-usual projection as a reference envelope.
Compare the trajectories that matter
Four scenarios, side by side, by scope and by GHG Protocol category — any two mirrored against each other:
The business-as-usual side is read from the projection the calculation engine produced out of your own growth drivers; the target side from the target set itself. Neither is a rule of thumb applied to the baseline.

Benchmark against the commitment
A plan can be linked to a target set built in step 3 — including SBTi-aligned targets with their coverage thresholds and 1.5 °C trajectories — or to a target created inline as a reduction percentage or an absolute cap. Once linked, the plan continuously reports its target total, its gap in tCO2e and the same gap as a percentage, recomputed on every change.
Reuse what you have already quantified
Recurring measures are stored as reusable library items — name, category, applicable scopes, transformation and default parameters. The library has two layers: a system catalogue maintained by Climact, and your own client layer, so an organisation accumulates its vocabulary of measures across plans, sites and years. Any measure built in a plan can be saved back to the library in one click.
Take it out of the platform
A plan exports to a single Excel workbook built server-side: the baseline lines, the resulting lines after all measures, the full action history, and a summary of totals. Charts export individually as images for board packs. Because the export carries the row-level before and after, a verifier can reconstruct every figure without access to the platform.
03
Why the numbers hold up
The credibility of a transition plan rests on whether its arithmetic can be reproduced by someone who did not build it. Four design rules govern that.
Rule 01
The baseline is a snapshot, not a re-entry
A plan starts from the exact rows a completed calculation produced for the chosen year and GHG report. Nothing is retyped, so no reconciliation step exists.
Rule 02
Measures act on inputs, not on totals
Transformations change activity quantities and emission factors at row level. Emissions are recomputed from them — the arithmetic of the plan is the arithmetic of the footprint.
Rule 03
Every change replays the whole plan
Adding, editing, reordering or deleting a measure recomputes the sequence from the baseline. No incremental state can silently diverge from the list on screen.
Rule 04
Everything is kept
Baseline rows, resulting rows and the ordered action history are persisted with the plan and travel together into the export.
Consequences worth knowing
- Results are order-dependent by design. The same measures in a different order produce different contributions per measure, and the same final total only when the measures are independent.
- The fixed-tonnage transformation distributes its volume pro-rata to each line's share of emissions; it cannot remove more than the selection contains, and says so when asked to.
- Scope allocation follows the GHG Protocol category carried by each line, so a measure touching several scopes reports its effect on each separately.
- Market-based and location-based are separate baselines. A plan is built on one of them, explicitly.
04
The platform underneath
myClimact is a web application — nothing to install, nothing to run locally. A single-page front end is served from a CDN and talks over HTTPS to a Python calculation API. It runs on AWS, with client data stored and processed in the eu-central-1 (Frankfurt) region.
The browser holds no calculation logic. Every figure on screen was computed server-side by the same engine that produced the footprint — the same code path serves the footprint, the targets and the action plan, which is why a plan cannot disagree with the footprint it came from.
| Layer | Technology |
|---|---|
| Front end | React 18, TypeScript, Vite, Tailwind CSS |
| Delivery | Static bundle on Amazon S3 behind CloudFront (TLS, HTTP/2) |
| API | Python 3, FastAPI, Pydantic v2 — REST, JSON, OpenAPI-described |
| Calculation | pandas / numpy / scipy, executed server-side |
| Data stores | PostgreSQL 16 for metadata, Amazon S3 for row-level payloads |
| Identity | Amazon Cognito — OAuth 2.0 / OIDC, RS256 JWTs |
Integration
The application is one consumer of a documented REST API — the same interface is available to integrate the platform into your own reporting stack. The endpoint reference is part of the technical pack shared under NDA.
05
Security and access control
Authentication
Users authenticate against Amazon Cognito. The API accepts only signed RS256 JSON Web Tokens, verified on every request against the pool's published keys, with issuer, audience, token type and expiry all checked server-side. No request is served on the strength of anything the browser asserts about itself.
Authorisation
Permissions are resolved server-side and delivered to the browser as a workspace manifest — the explicit list of what a user may see and do. The front end renders that manifest; it never derives permissions on its own. Four levels compose:
| Level | Controls |
|---|---|
| Module access | Whether a whole area of the platform — the Action Plan among them — exists for this user at all. |
| Organisation access | Which client organisations a user may open. Plans, datasets and action libraries are scoped to one organisation. |
| Dataset access | Which footprints inside an organisation a user may read, down to the individual dataset. |
| Feature entitlements | Fine-grained rights within a tool, used for tiered licensing. |
Entitlements are computed from your organisation's own access records rather than from group membership asserted by the client application, which keeps them auditable and reviewable user by user.
Data handling
- All traffic is TLS-encrypted; the application is served over HTTPS only.
- Client data is stored and processed in the AWS eu-central-1 (Frankfurt) region.
- Production and test run as separate environments, each with its own database schema and its own storage prefix.
- Database credentials are held in AWS Secrets Manager — never in application code or configuration files.
- Row-level footprint and plan data is stored separately from the relational metadata, and is only ever served through the authenticated API.
Assurance
The codebase undergoes periodic security and robustness reviews covering the front end, the API and the access layer, with findings tracked and prioritised. We answer security and data-protection questionnaires under NDA, and prefer to receive them early: it is the fastest way to establish precisely what the platform covers for your organisation, and what would need to be put in place.
06
Data in, data out
The Action Plan is never the entry point for data. It consumes a footprint already built and validated, which means the quality controls of step 2 apply to everything a plan states.
Into the platform
Three routes in
The Climact Excel template — activity data, organisational structure, emission-factor corrections and growth drivers, validated on upload; configurable emission-factor databases with a full resolution trace for any factor; and imports of already-computed footprints from third-party carbon platforms, so an organisation with an incumbent tool can still build its plans here.
Out of the platform
Four routes out
The action plan workbook — baseline rows, post-measure rows, action history and summary; footprint and results exports from step 2; individual chart images for reporting; and the documented REST API for integration into your own stack.
07
How an engagement runs
The module is designed for a mixed team: Climact consultants who quantify measures, and client staff who own them. A typical cycle:
- 1Agree the baseline — Select the dataset, reporting year and GHG report the plan will be defended on.
- 2Link the commitment — Attach the SBTi or internal target set and its target year; the gap is reported from the first measure onwards.
- 3Quantify measures — For each measure, scope the footprint lines it touches and choose the transformation that represents it.
- 4Review with owners — Read the impact per measure and per entity; each owner sees their own lines.
- 5Compare options — Duplicate the plan, vary ambition or sequencing, compare against BAU and the target.
- 6Hand over — Export the workbook; take the selected plan into implementation and disclosure.
Role
The climate lead
Builds and compares plan options, defends the pathway internally, tracks the remaining gap.
Role
Site and business-unit owners
See exactly which activity lines a measure touches and what it delivers for their perimeter.
Role
The Climact consultant
Quantifies measures with you, maintains the shared action library, hands over a reproducible plan.
Annex
Glossary
| Term | Meaning |
|---|---|
| BAU | Business as usual — the emissions trajectory implied by the organisation's own growth drivers if no measure is taken. |
| Emission factor | The coefficient converting an activity quantity into emissions. |
| GHG report | The accounting convention a footprint is stated in — principally market-based or location-based for electricity. |
| GHG Protocol category | The standard classification of an emission source (1.1, 2.1, 3.1 through 3.15) that determines its scope. |
| Plan option | One action plan among several built on the same organisation, so alternatives can be compared. |
| Replay | Recomputing a plan by re-applying every measure in order from the baseline. |
| SBTi | Science Based Targets initiative — the framework for validating 1.5 °C-aligned reduction targets. |
| tCO2e | Tonnes of carbon dioxide equivalent. |
Next step
See it on your own footprint
The fastest way to judge the module is a working session on your own data — one reporting year, one target, and three or four measures you already have in mind.
- Live walkthrough — 45 minutes on a demonstration dataset, no preparation required on your side.
- Pilot on your footprint — We load a year of your data and build a first plan option with you.
- Technical due diligence — Architecture deep-dive, API documentation, and security questionnaire responses under NDA.
Action Plan · last updated 28 August 2026. Figures shown in the product are illustrative. Contact your Climact representative for a demonstration or a security questionnaire response.